What We Do
 Edeva’s goal is to contribute to the United Nations’ global sustainability goals. We achieve this by facilitating the transition from car transportation to more sustainable alternatives such as buses, walking, and cycling, while also saving lives on the roads. The “Vision Zero,” pursued by the Swedish road safety industry, aims for zero serious injuries or deaths within the road traffic system. We believe it is worth striving to contribute to this vision.
How We Do It
 Through our innovative active speed bump, also known as an active dynamic speed bump, we aim to promote smooth traffic flow and convenience for buses, emergency services, and other traffic, as long as they adhere to the speed limits. This creates a safer and more secure environment for unprotected road users when crossing the street, ultimately saving lives.
Different Types of Speed Bumps
A speed bump can be designed in various ways and can be either completely static, passively dynamic, or actively dynamic.
Static Speed Bumps
Static speed bumps are common humps, speed cushions, or other types of elevations. They can also include chicanes or other horizontal deflections.
Passively Dynamic Speed Bumps
Passively dynamic speed bumps are designed in a way that heavy vehicles can pass almost without discomfort, similar to a speed cushion. However, car drivers experience similar discomfort to solid obstacles and are forced to significantly reduce their speed.
Actively Dynamic Speed Bumps
“An active dynamic speed hump is designed to only be active when a speeding vehicle is approaching. The intrusion on traffic flow is thereby smaller and the traffic may maintain a more even speed according to the speed limit since the hump does not affect the traffic at all as long as the speed limit is respected. ” (Bagdadi & Patten).
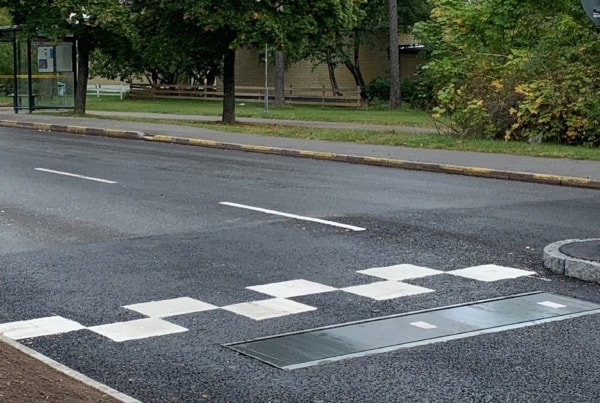
Actibump
An active dynamic speed bump reacts differently depending on the speed. Our active dynamic speed bump is called Actibump. It maintains good accessibilty for all road users while creating a safe and secure traffic environment. By only activating for those who choose to exceed the speed limit, a law-abiding driver is rewarded with a flat road, and Actibump becomes a speed bump only for those who exceed the speed limit.
Actibump and Snow Removal
The Actibump being flat in its original position facilitates snow removal, as it can be plowed straight over it. No manual shoveling or additional specific actions are needed. The area under the hatch has space for a lot of snow, and there is a heating coil that melts the snow so that it drains into the roadwater inlet connected to Actibump.
Actibump and Buses
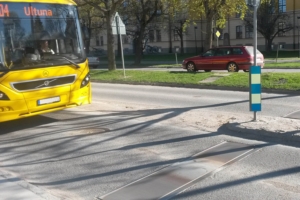 By creating a flat road for buses traveling at legal speeds, we also make public transportation more enjoyable. Bus journeys become less shaky, and buses can maintain a higher average speed when they don’t need to slow down significantly due to numerous speed bumps. Actibump not only enhances the passenger experience but also improves the working environment for bus drivers who would otherwise suffer neck and back problems from driving over static bumps all day.
Actibump and Emergency Vehicles
There is functionality to make exceptions for emergency vehicles, allowing them to have a flat road even when they are on an emergency call. They usually prefer Actibump over regular speed bumps since their vehicles are damaged by driving at emergency speeds over static speed bumps.
Traffic System
Actibump is not just a dynamic speed bump, it is a traffic system that continuously and in real-time measures traffic. Continuous real-time measurement is a powerful tool for monitoring historical results, assessing the system’s impact, and reacting to trends and changes over time. Knowing how traffic behaves enables taking actions to guide it as desired, and with Actibump, one can monitor and follow up on the measures put in place.
The need for Actibump
Our system is designed to address the complex traffic situations found in cities worldwide, where a trade-off must be made between traffic safety and traffic flow. Situations where one cannot or does not want to use the old conventional methods. This is particularly important in places where the only real alternatives to solve the problem are much more expensive and take up more space. Traditional solutions like pedestrian tunnels, footbridges, or roundabouts can be significantly more complex, expensive, and time-consuming to implement than digging a hole and installing an Actibump.
Purpose of Actibump
A safe and secure network of crossings encourages parents to let their children walk or cycle to school. A shift to active mobility benefits both individual health and the environment. By creating more safe and secure crossings, we promote a sustainable and safe traffic environment, encouraging increased use of environmentally friendly transportation options.
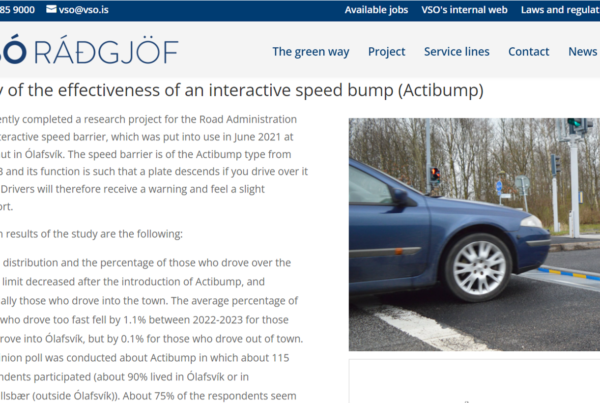
Evaluations of Actibump
Actibump has been evaluated several times. You can find our own evaluations, the city of Malmö’s and Trivector’s two evaluations on our website. The city of Stockholm has also conducted an evaluation. There are over 100 Actibumps installed, most in Swedish municipalities, but also in Norway, Denmark, Australia, and Iceland. The Swedish Transport Administration (Trafikverket) has installed Actibumps, first in a pilot project and now in full implementation with a framework agreement.
A thesis has also been conducted, comparing different types of speed bumps. The study concluded that for the analyzed intersection, Actibump would be the best solution.
Actibump and EdevaLive
 The vehicle data collected by Actibump is visualized in a software platform called EdevaLive. All vehicle data is completely anonymized, and no personal data is stored. EdevaLive visualizes data about traffic flow, speed compliance, and traffic composition.
Edeva has now developed a dashboard demonstrating the benefits of Actibump and showcasing its results. This dashboard specifically presents a couple of Actibumps in Helsingborg. The dashboard is completely open, and you can access it by scanning the QR code or visiting live.edeva.se/actibump-dashboard.
An Overview of the Dashboard:
Map
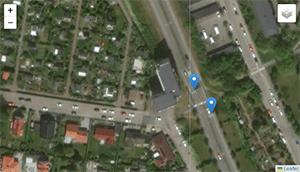 The map provides an overview of the current locations of the Actibumps. You can zoom out to see more of the traffic environment and switch from satellite to map view via the symbol in the top right corner of the map.
Real-Time Data
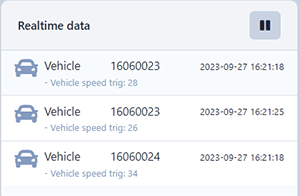 Press the play button, and real-time data will start streaming in. It blinks green if a vehicle passing by adheres to the speed limit and red if the vehicle is speeding. If you zoom in on the map, only real-time data from the Actibump visible on the map will be displayed.
Charts
The charts display real-time statistics that can be broken down from month to hours. You can export the data you see in the chart as an image or get it in CSV format.
You can use the buttons above the chart to control from which Actibumps you are fetching data. If you select more than one Actibump, the data will be averaged over time between them. If it is counter data, it will be summed up. You can choose the time interval and frequency for the data.
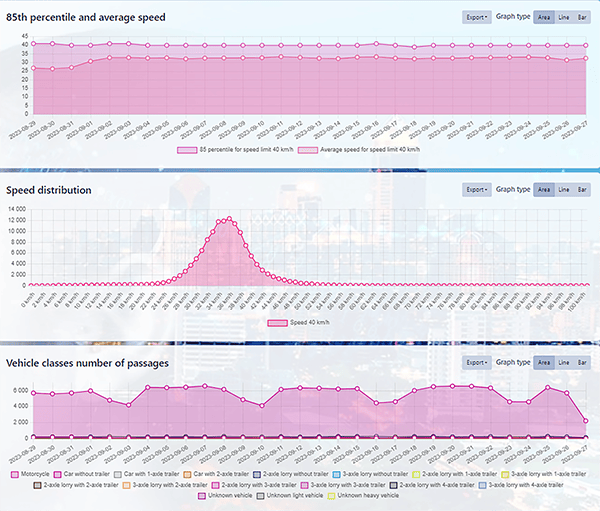 The top chart displays the 85th percentile and average speed. The 85th percentile is the value most often looked at when determining if a location is safe .from a traffic safety point of view. One wants the 85th percentile to be as close to the speed limit as possible to achieve a smooth traffic flow at a safe speed. At the current location, the speed limit is 40 km/h.
The second chart from the top shows the speed distribution – how many vehicles are driving at what speed. Here, we want a sharp curve with the peak to the left of the speed limit. This gives us the best flow. We want as few as possible driving too fast and as few as possible driving unnecessarily slow to get a smooth flow at a safe speed.
The third chart from the top shows the number of vehicles per vehicle type. This data is interesting to determine the composition of vehicles on a street. If there is a lot of heavy traffic or many long vehicles, it imposes different requirements on maintenance and road design than if you only have regular car traffic. Traffic counting can show the composition of vehicle types in a traffic flow, enabling actions to either promote that type of traffic or try to change the composition. With this kind of continuous traffic counting, you can also follow up on the measures you take and see trends and changes over time.
Symbols
 At the bottom of the page, you’ll find two symbols. The API symbol takes you to our website where you can request to see the API documentation and/or our parameter list. The list contains all the data we can provide with comments on what it is and in what units it comes.
The QR code is to share the dashboard with anyone. It is completely open, and you are free to distribute it to whomever you want.
Want to know more?
Sign up for our newsletter to receive updates, or contact us!